
Why Trend Lines are Powerful With Trading

The closest predictor indicators when it comes to trading are:
Price action and volume.
I’m going to talk a bit about Price action today as Volume is a whole different cattle of fish.
With TradingView charting platform there are a few indicators to identify a trend:
Trend lines, Bollinger Bands, Moving Averages, Candlesticks and other bands and channels too numerous to mention.
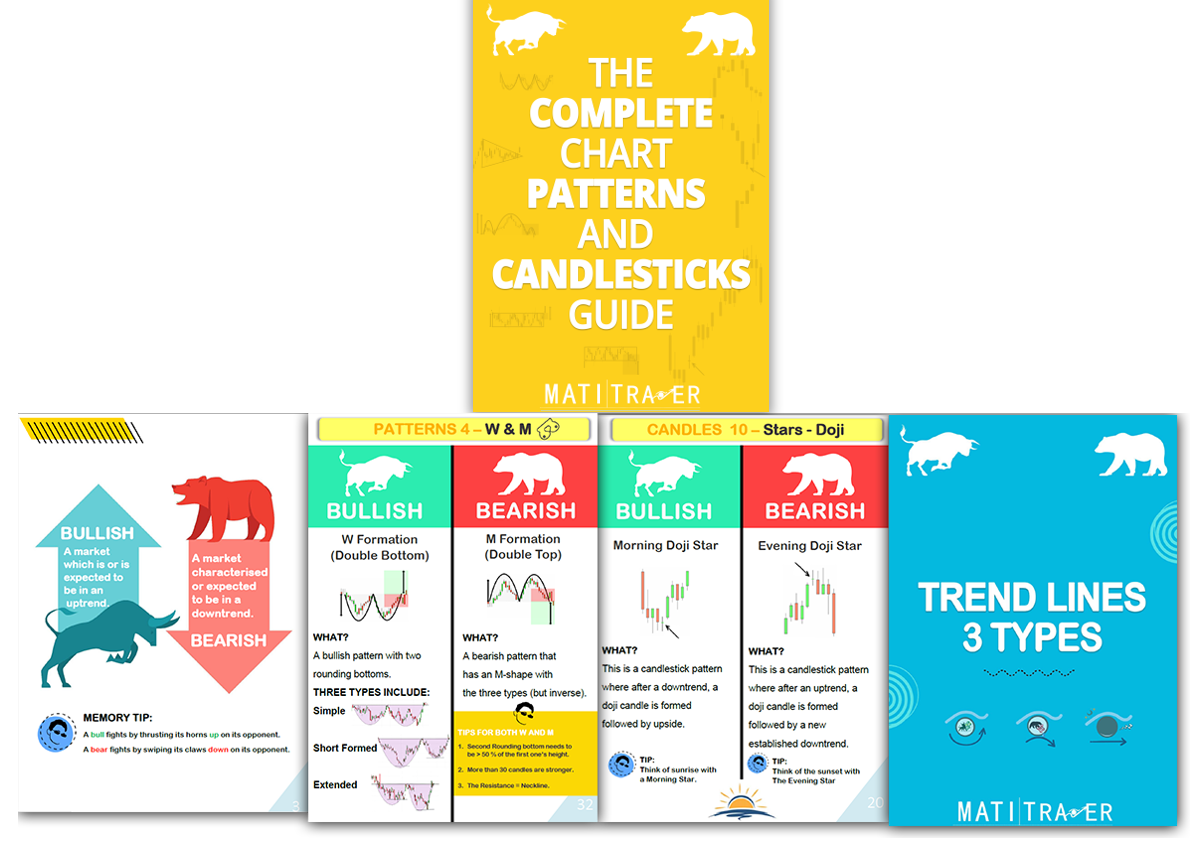
#1: Trend Lines – Trend detector
Trend lines are perfect for pointing out the direction of the market.
Trend lines are a useful tool for identifying the direction of a market. They are a straight line that is plotted through a series of data points.
You can either plot a straight diagonal line to determine whether the market is going up or down.
Or you can plot horizontal lines to identify ranges, sideways consolidation areas.
That’s because trend lines plot through a series of data points on the charts to help point out whether the trends are moving up down or sideways.
There are a number of benefits with using trend lines including:
• Trend directions
To help identify the overall direction of the market, whether it is trending up, down, or sideways.
• S&R levels
Point out key support (floor levels) and resistance (ceiling levels) These are great for points of entry.
• Chart patterns and breakout levels
Chart patterns are also used with trend lines. Especially neck lines, brim levels, box formations etc…
• Points of reversals
We also use trend lines to wait for a break in structure. Once this happens, we can see if the market is about to change direction and reverse.
• Convert chaos into order
End of the day all technical analysis and price action is used for confirmation bias. To apply to a strategy and to make calculated and informed decisions on what to do if something happens. Almost like a If this then That!
I’ve used trend lines and price action since 2003 and they remain an important element to trading analyses. End of the day, the market can only move up, down and sideways.
And you know why?
Because the famous psychology of demand and supply will always work.
And so they are here to stay and we might as well take advantage of it.


Order via our secured website:
Click here to order The Complete Charts Patterns and Candlesticks Guide by MATI Trader book
Or order via EFT payment”
Click here to order the book via EFT (all info in the invoice).
Enjoy and remember…
You won’t need to buy or order another book on chart patterns and candlesticks ever again as I will be updating it very often and will let you know.
Trade well, live free.
Timon Rossolimos
Founder, MATI Trader
Not sure the best way to get started with MATI Trader?
Follow these steps to start your successful trading journey.